
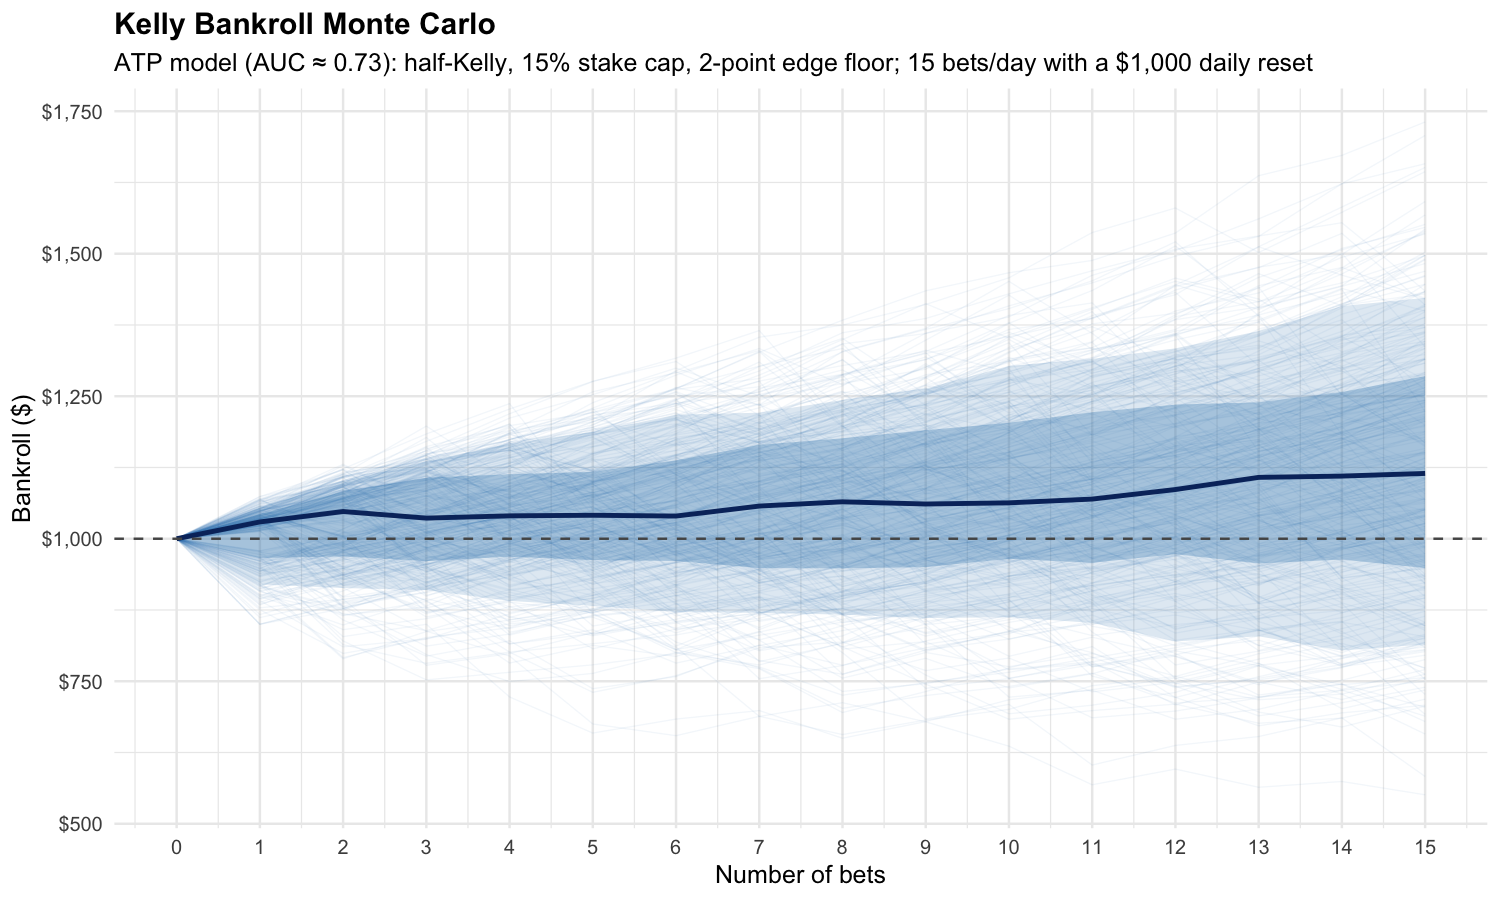
A match model is only half of a betting plan. The other half is sizing: how much of the bankroll goes on each edge, and what that choice does to the shape of a day. To pressure-test the sizing rules before risking anything real, I ran a Monte Carlo over a single trading day — 1,000 simulated days, each 15 bets long, starting from a $1,000 bankroll that resets every morning.
The engine underneath is an ATP match model with an out-of-sample AUC of about 0.73 — good enough to be worth betting, not good enough to be forgiving. Stakes follow a half-Kelly fraction, capped at 15% of the bankroll on any one bet, and only fired when the modelled edge clears a two-point floor. Everything below is what those rules produced.
The median day ends up, but only modestly — from $1,000 to roughly $1,120. What the fan really shows is variance: a genuine but thin edge, wrapped in a cloud of paths that finish anywhere from the $800s to the $1,400s. On any single day, noise dominates the signal.
The day is bumpier than the ending suggests
An ending bankroll hides the ride it took to get there. Tracking the worst peak-to-trough drop inside each simulated day tells a more honest story about what the sizing feels like in the moment.
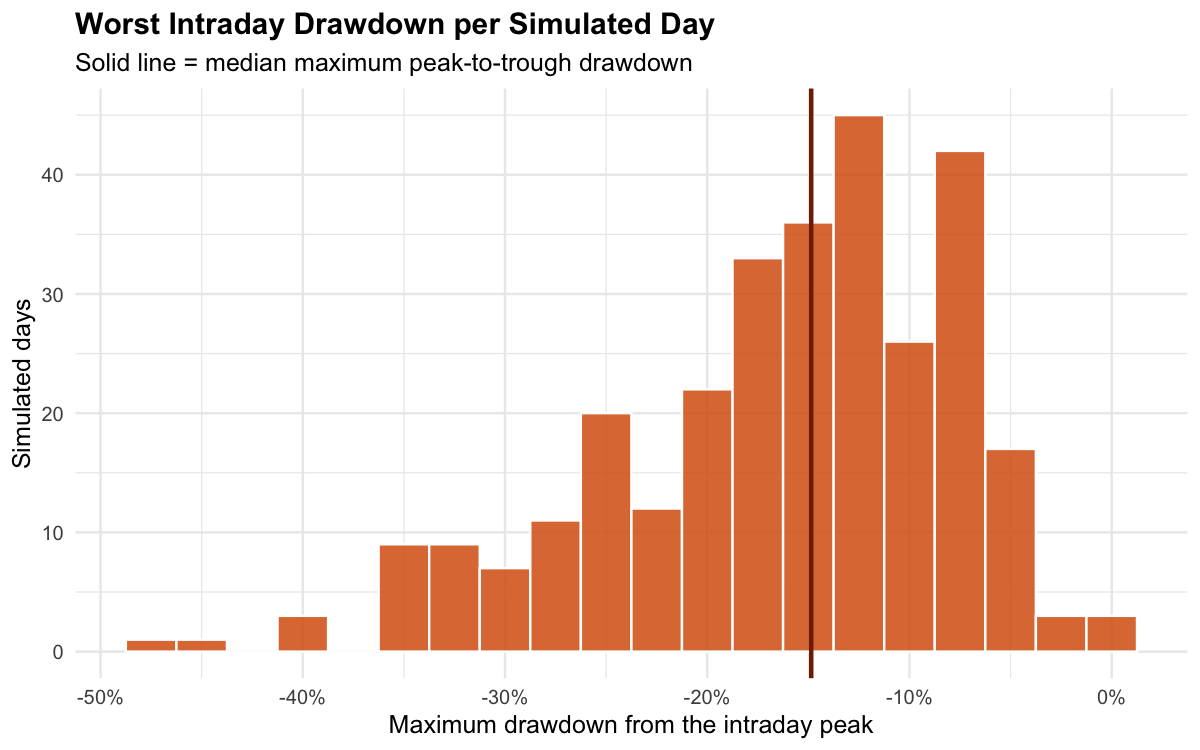
The typical day gives back around 15% from its high-water mark at some point, and the tail is not academic: a meaningful share of days draw down 30% or more before the session closes. A plan that only looks at end-of-day results will badly underestimate how often the bankroll looks like it is losing.
Where the day tends to end
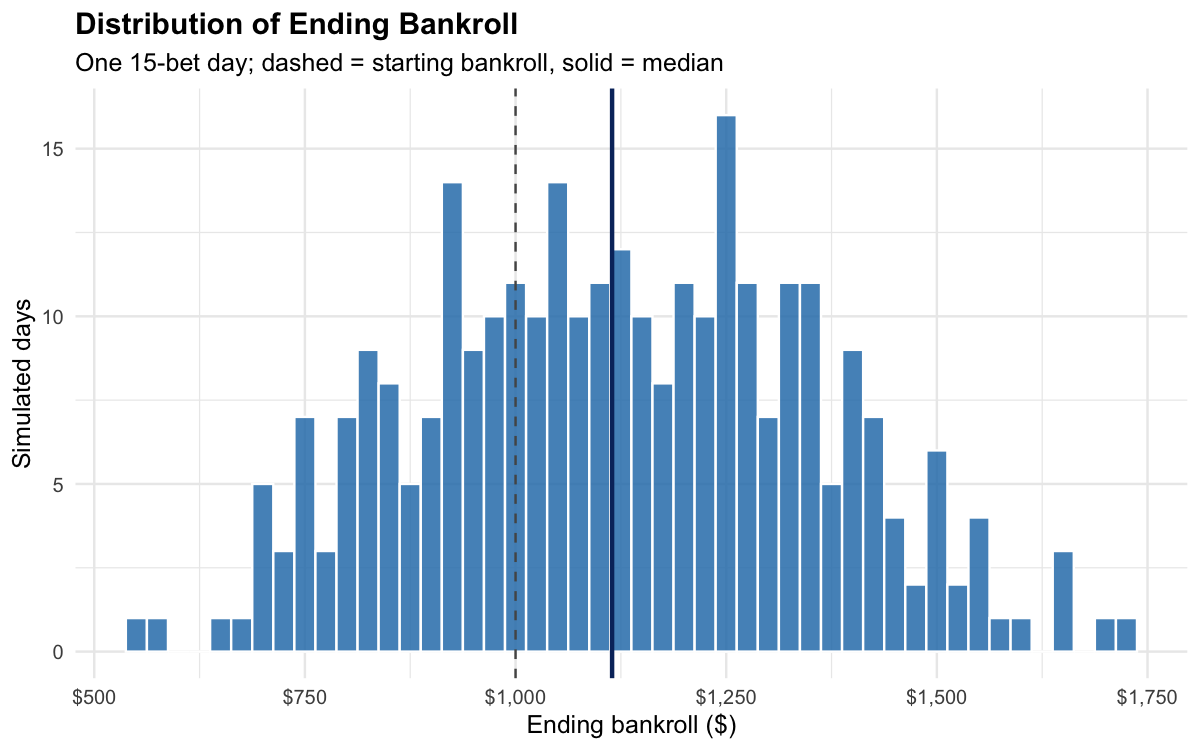
The ending distribution is close to symmetric with a slight lean to the upside — the signature of a small positive edge compounding through Kelly sizing. The median finishes a touch above the start, plenty of days finish red, and the fat right tail is where the profit actually lives over a long enough sample.
Sizing is the biggest lever
The same model and the same bet outcomes look completely different depending on the Kelly multiplier. Holding every simulated bet fixed and changing only the fraction isolates what sizing alone does.
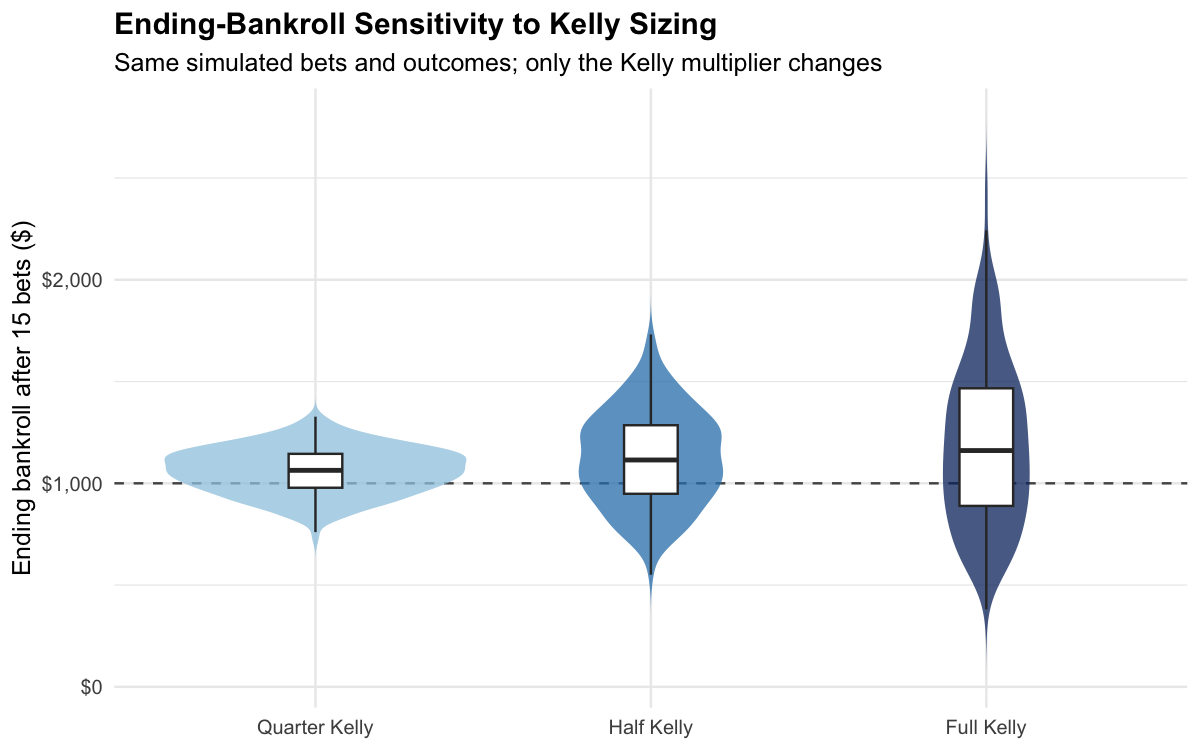
This is the argument for staking conservatively when the model's edge is uncertain. Full Kelly stretches the distribution in both directions — a taller upside, but a downside that reaches toward zero — while barely lifting the median. Quarter Kelly is almost boring by comparison. Half-Kelly is the compromise the main plan uses: most of the growth, a fraction of the ruin risk.
Being ahead is not the same as being right
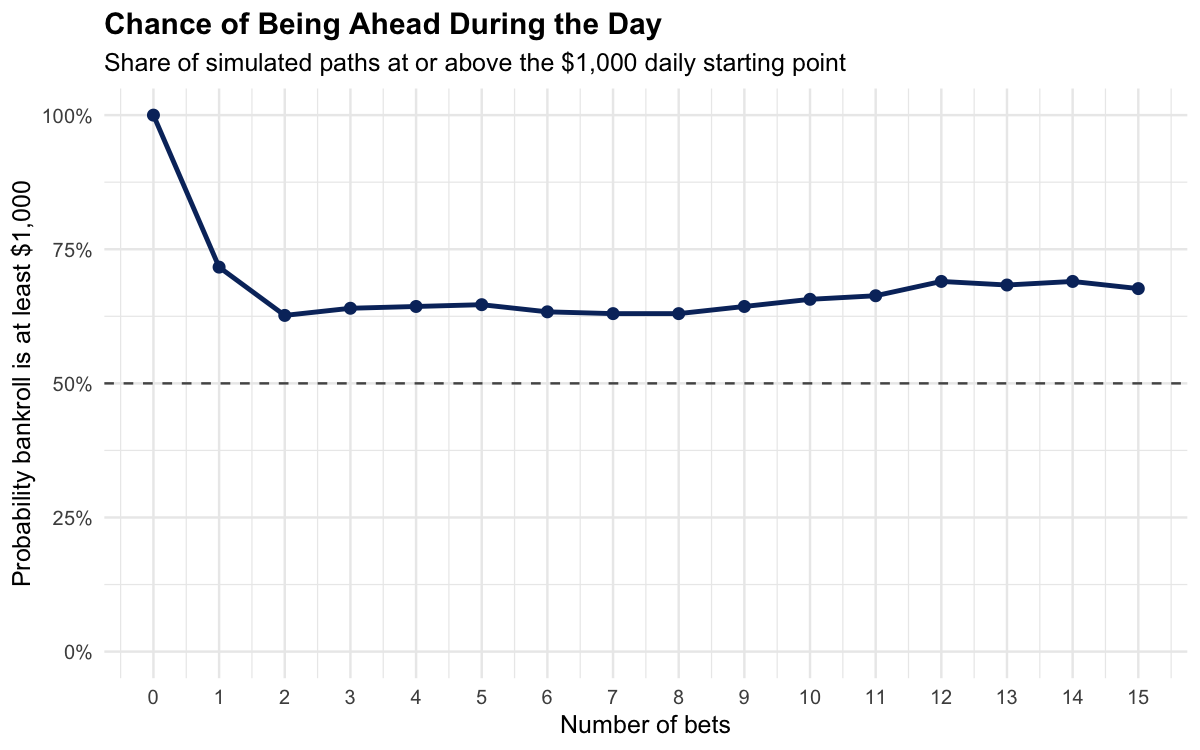
Even with a positive-expectation model, the chance of sitting at or above the starting line dips fast — to roughly 63% after just a couple of bets — before the edge slowly pulls it back up toward 68% by the end of the day. In other words, a winning system spends a lot of the day looking like a losing one. That gap between correct and ahead is exactly where discipline breaks down.
What the day says
- The edge is real but thin. A 0.73-AUC model earns a small positive drift, not a steep one.
- Variance runs the day. Expect a ~15% intraday drawdown as normal, with a tail to 30%+.
- Sizing dwarfs selection. Moving from full to quarter Kelly changes the risk profile more than most model tweaks.
- Stay conservative. Half-Kelly with a stake cap and an edge floor keeps the ruin tail off the table while keeping most of the growth.
None of this makes the model better. It makes the plan around the model survivable — which, over a season of these days, is the part that actually compounds.